The Logs page displays detailed records of the plugin’s operations so that you can review the events that have occurred over time. It is divided into two main sections (tabs):
- Content Plan Logs:
This section records all events related to content plan generation, including when a plan is created and its associated costs. - Post Generation Logs:
This section shows logs for individual article generations, including post details, associated costs, and the time each article was generated.
How to Use the Logs Page
- Filtering Logs by Period:
- At the top of the page, a filter form allows you to select a time period for viewing logs.
- You can choose from predefined periods such as:
- All Time
- Last Week
- Last Month
- Last Year
- For a more specific time frame, select Custom. This will reveal two date fields where you can enter your desired start and end dates. Once set, click the Apply button to refresh the logs.
- Navigating Between Tabs:
- Two tabs are available at the top:
- Content Plan Logs (shows logs related to content plans)
- Post Generation Logs (shows logs related to individual article generation)
- Each tab button displays a data count indicating the number of records available for that category.
- When you click on a tab, the corresponding logs are displayed below. The total record count is also updated in the header.
- Two tabs are available at the top:
- Viewing the Logs Table:
- The page presents the logs in a table format.
- For Content Plan Logs:
- Each row includes the date, type of log, text model used, total articles generated, interval, period, language, categories, and the total estimated cost.
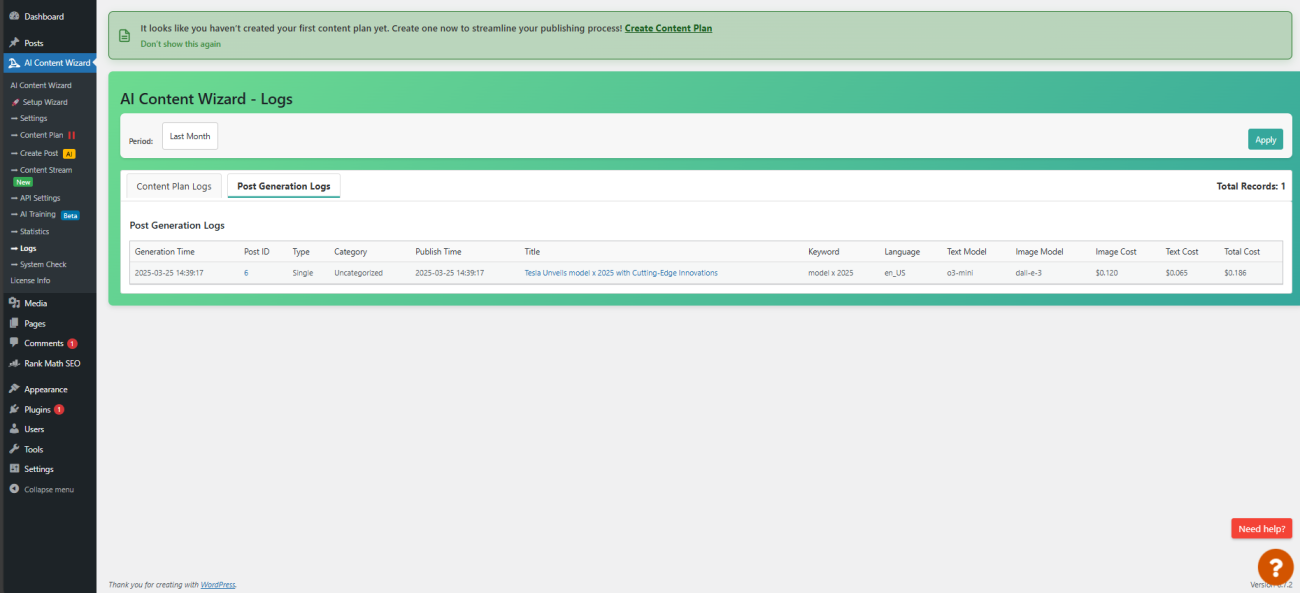
- For Post Generation Logs:
- The table displays the generation time, post ID (with a link to edit the post), type, category, scheduled publish time, title (with a link to view the post), keyword, language, text model, image model, image cost, text cost, and total cost.
- Pagination is available if there are more records than can fit on one page, allowing you to navigate through multiple pages of logs.
Important Considerations
- Estimated Data:
The numbers and cost estimations displayed are calculated based on logged events. They are approximate figures and may not exactly match real-world values. - Dynamic Data:
Since the logs are generated in real time and depend on the plugin’s activity, you may see changes in the data as new logs are added or old ones are archived. - Filtering Accuracy:
If you select a custom date range, ensure that both start and end dates are correctly entered. The logs displayed will strictly follow the specified period.
By reviewing the Logs page, you can gain insights into the plugin’s performance over time and monitor the efficiency and costs associated with content generation.


