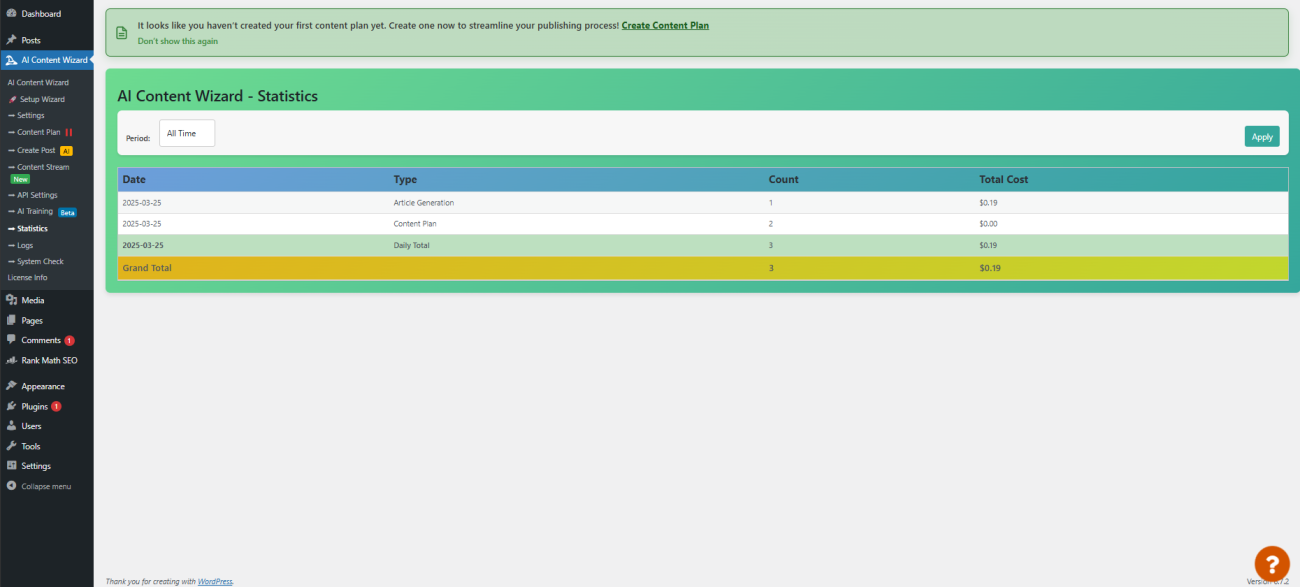
The Statistics page provides an aggregated overview of your plugin’s activity over time. It displays key metrics related to the generation of articles and content plans, such as the number of events and the total estimated cost incurred for each event type.
How to Use the Statistics Page
- Filter by Time Period:
- At the top of the page, you will find a filter form that lets you select the time period for the statistics.
- You can choose from predefined options: All Time, Last Week, Last Month, or Last Year.
- If you choose the Custom option, two date fields will appear. Enter your desired start and end dates to view statistics for that specific period.
- After selecting your preferred period, click the Apply button to update the data displayed.
- Reviewing the Data Table:
- The page displays a table that breaks down the statistics by date.
- For each day, the table shows:
- Date: The specific day for which data is recorded.
- Type: The type of event (e.g., Article Generation or Content Plan).
- Count: The number of events recorded on that day.
- Total Cost: The estimated total cost incurred for the events on that day.
- Additionally, each day has a summary row (Daily Total) that aggregates the event counts and costs, followed by an overall summary row (Grand Total) for the entire selected period.
Important Considerations
- Estimated Data:
The values shown on the Statistics page (including counts and estimated costs) are calculated based on the logs collected by the plugin. They serve as an approximation and may not perfectly reflect the actual real-world costs or exact numbers. - Data Variability:
Due to the nature of data aggregation and the dynamics of how the plugin logs events, the statistics might differ slightly from the real values. They are intended to give you a general overview rather than an exact financial statement. - Usage Monitoring:
Use this page to monitor the overall activity of your content generation processes. It can help you assess performance, identify trends, and understand how often the plugin is generating content over various time periods.
By using the Statistics page, you can quickly gain insights into your AI Content Wizard activity, adjust your strategies if needed, and ensure that your content generation efforts are on track—all while keeping in mind that the displayed numbers are estimates.


